Your First Engagement
This page walks you through setting up and running your first engagement in RTF from start to finish.
Step 1 — Log In
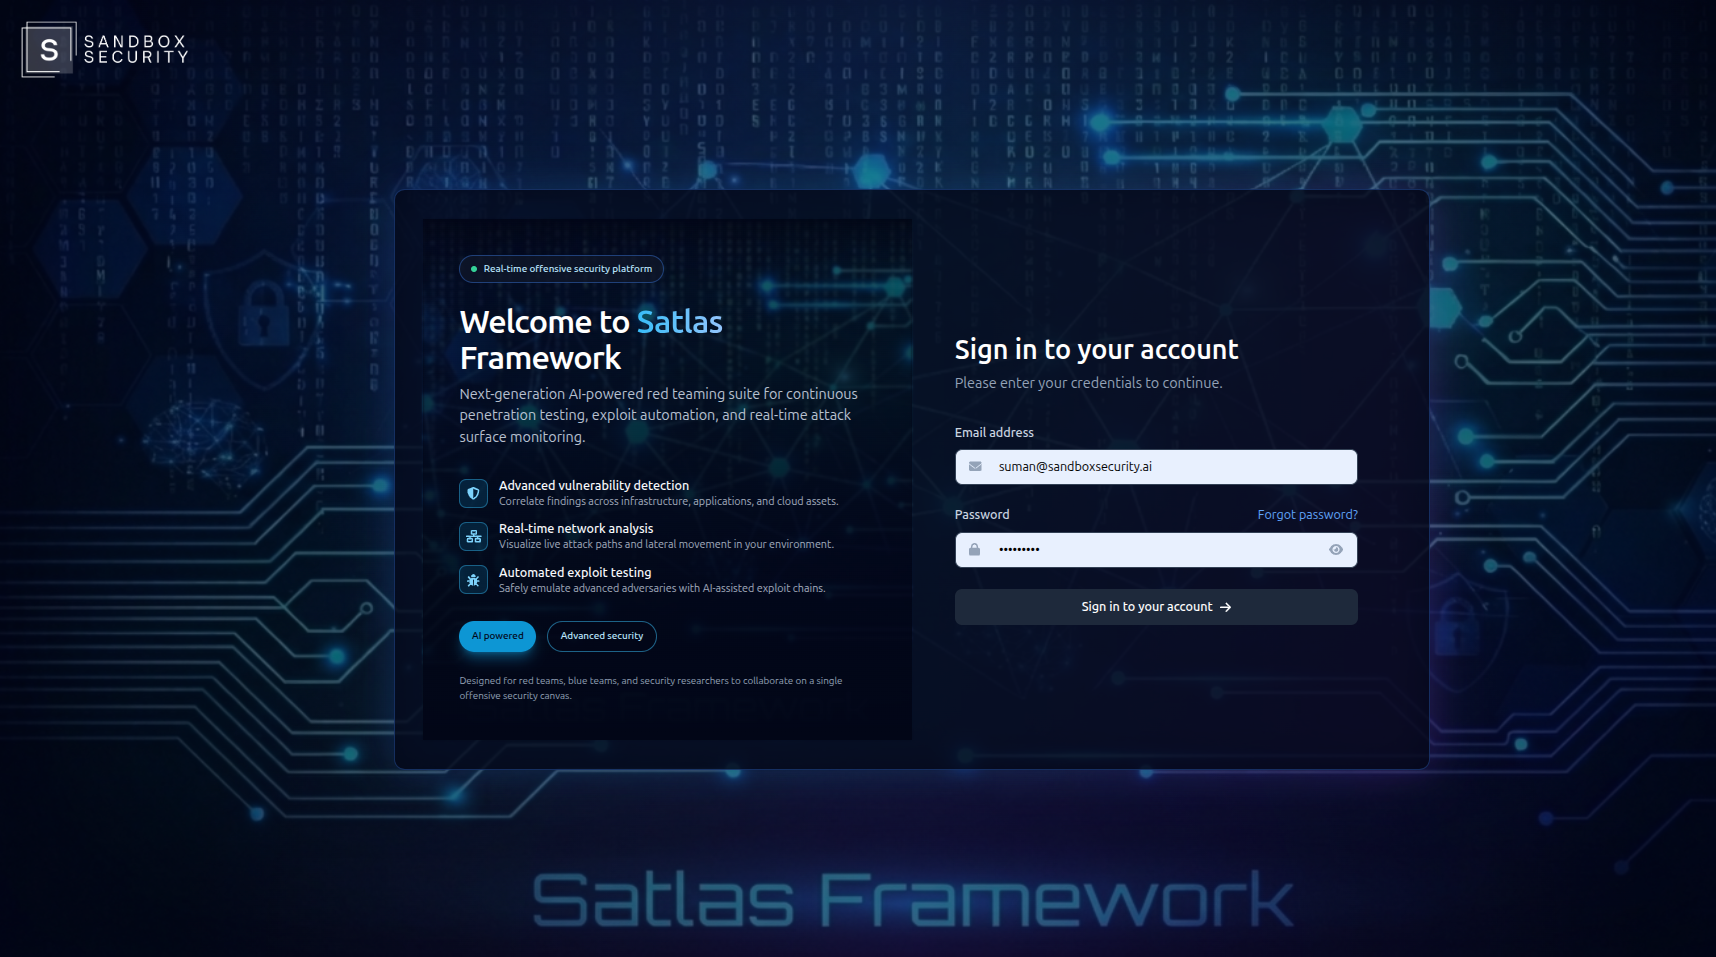
Before anything else, you need to log in to RTF.
Open your RTF instance in the browser (e.g., https://stalas.sandboxsecurity.ae/signin ) and sign in using your credentials.
- Using shared credentials — your team lead or administrator will provide a username and password
- First-time self-hosted setup — use the credentials that recived in mail
If you're on a self-hosted instance and logging in for the first time, check with whoever set up the server for the initial credentials.
Step 2 — Configure Your RTF Server Endpoint
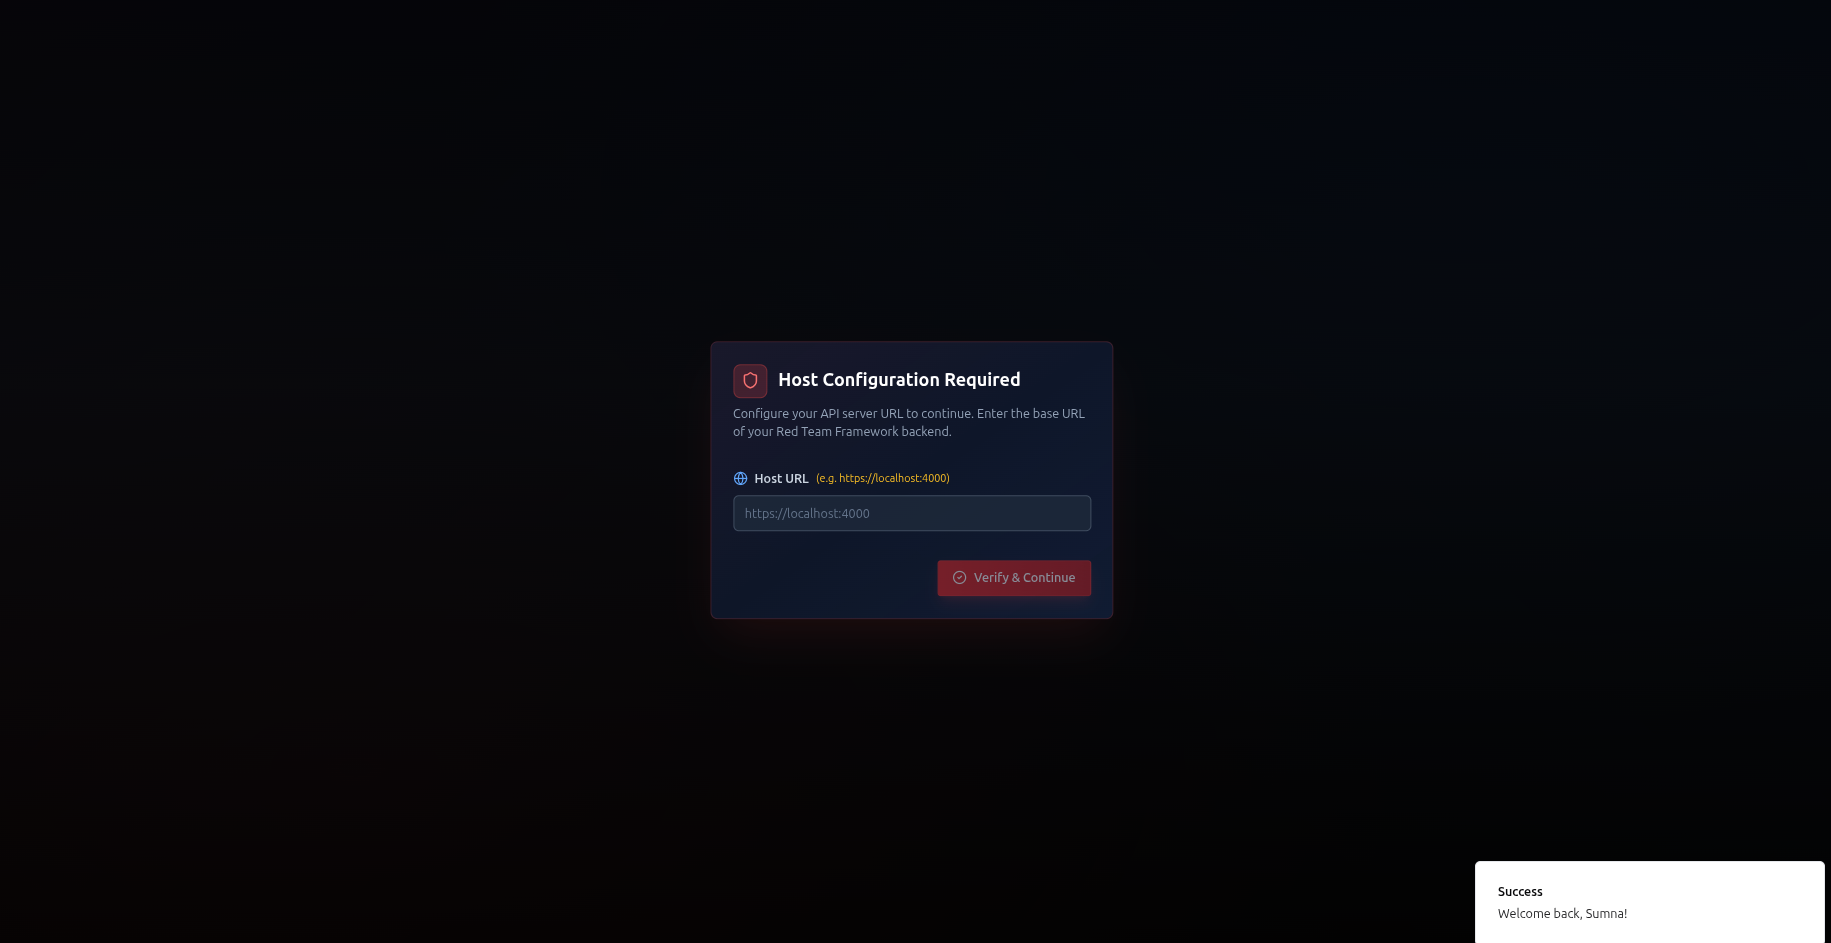
Before you can create engagements or use any features, you need to tell RTF where your core backend is running. This is the URL of the RTF Server you deployed via Docker.
Without a valid RTF Server endpoint configured, the platform has no engine to connect to. All features — navigator, findings, terminal, AI — depend on this connection.
- After logging in, look for the Settings or Server Configuration option (usually in the top-right profile menu or a first-time setup prompt)
- Enter your RTF Server URL — this is the address where your Docker container is running, for example:
https://192.168.1.100:4000— if running on a local machine by IPhttps://rtf.yourcompany.com:4000— if you've set up a domainhttps://localhost:4000— if running on the same machine as your browser
- Click Save or Connect
- RTF will verify the connection — you should see a confirmation that the server is reachable and healthy
Your RTF Server URL is the address where you ran ./setup.sh -s. By default it's https://localhost:4000. If someone else deployed it for your team, ask them for the server address.
RTF Server uses HTTPS. If you set up certificates with ./setup.sh -s, your browser will trust the connection automatically. If you see a certificate warning, you may need to run the certificate setup — see Installation →.If you noticed req blocked by the browser open your rtf-server url in new tab and safe to proceed and make a hard refresh on app
Once the server is connected, you're ready to start working. You only need to do this once — RTF remembers your server endpoint for future sessions.
Step 3 — Create a Profile
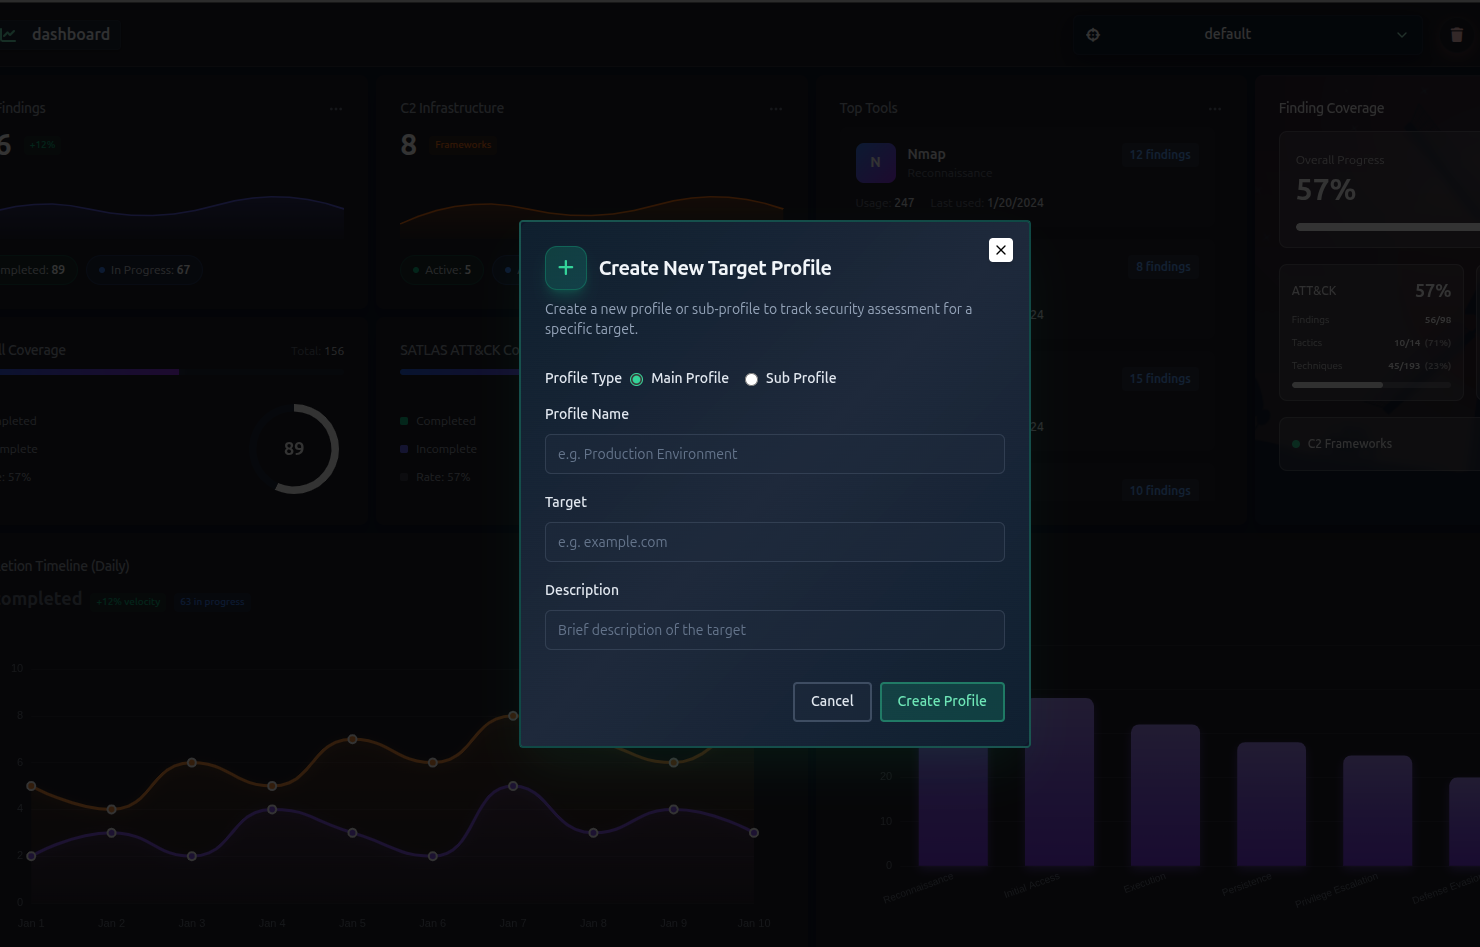
A profile represents your engagement target. Think of it as a project folder for everything related to one assessment.
- Click Create Profile or the + button from the main screen topbar
- Fill in the details:
- Name — a unique name for this engagement (e.g.,
acme-corp-2026) - Target — describe the target (e.g.,
ACME Corp — External Network) - Description — optional notes about the scope or objective
- Name — a unique name for this engagement (e.g.,
- Click Create
Use a consistent naming convention like client-year-type (e.g., acme-2026-pentest) so engagements are easy to find later.
When a profile is created, RTF automatically sets up:
- A fresh ATT&CK Navigator for the engagement
- A fresh ATLAS Navigator (for AI/ML assessments)
See Managing Profiles → for full details.
Step 4 — Create Subprofiles (Optional)
If your target has multiple segments (different networks, departments, or environments ), create subprofiles to keep findings organized separately.
- Go to Profiles in the topbar
- Click Add Subprofile and fill in the name and target from the drop down
- Repeat for each segment
If your engagement is a single, unified target — skip this step entirely.
See Subprofiles → for full details.
Step 5 — Define Your Scope
Before you start testing, decide which ATT&CK or ATLAS techniques are relevant to your engagement. This is called scoping — and you can do it in two ways:
Option A — Let AI suggest scope (recommended)
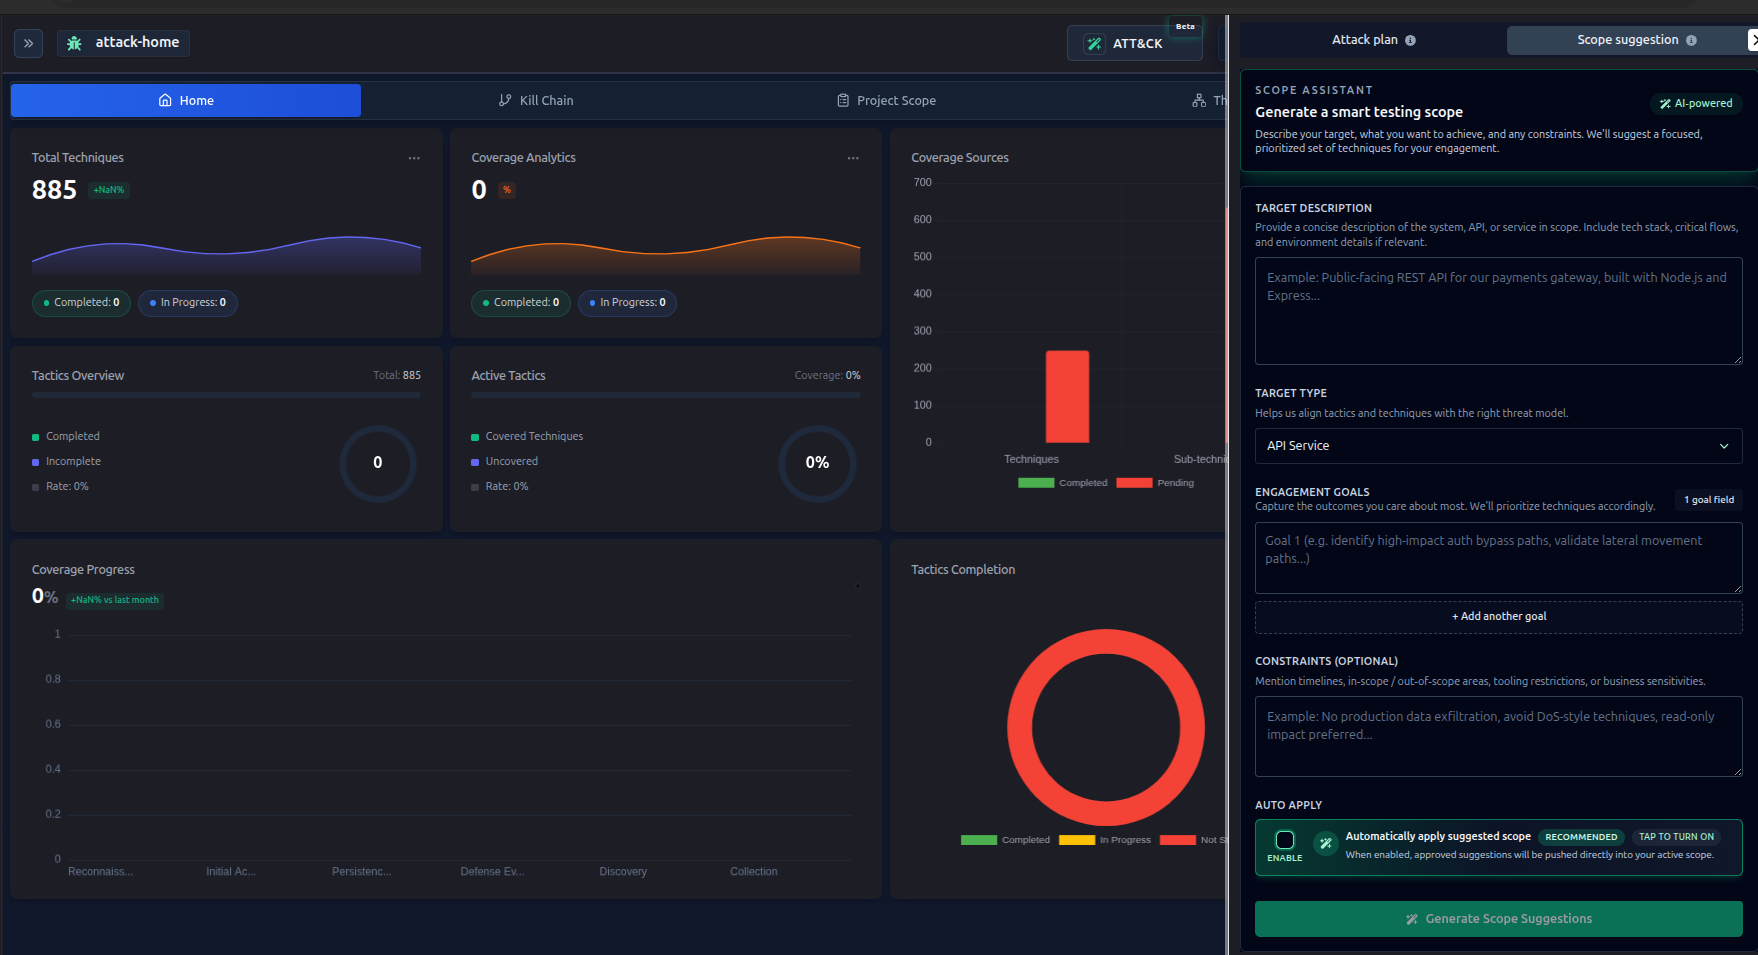
- Navigate to ATT&CK or ATLAS from side bar
- From top bar Click on ATT&CK or ATLAS button according your selection
- Describe your target in plain language
- Click Suggest Scope and review the recommendations
- Click Apply to mark suggested techniques as in-scope
See AI Scope Suggestions → for full details.
Option B — Mark scope manually
 If you already know which techniques apply — or prefer not to use AI — mark them yourself directly in the navigator:
- Open the ATT&CK Navigator / ATLAS Navigator
- Click on any technique
- Toggle In Scope on
- Repeat for all relevant techniques
Both approaches produce the same result — techniques marked in-scope appear highlighted in the navigator and are used in attack plan generation.
Admin can attached any note with the ttp's and also can edit , user just only read permission .
Step 6 — Generate an AI Attack Plan (Optional)
Once you have techniques in scope, RTF can generate a structured attack plan tailored to your target:
- Go to AI Features → Attack Planning
- Add context about your target and objectives
- Click Generate Plan
- Review the plan — it maps each attack phase to MITRE techniques
- Optionally refine it by providing feedback and clicking Refine
If you prefer to work directly from the navigator without an AI-generated plan, skip this step. The plan is a guide, not a requirement.
See AI Attack Planning → for full details.
Step 7 — Write Your TTP Notes (Optional but recommended)
Every technique in the SYSTEM Navigator has a built-in markdown notes file — your personal TTP guide for that technique in this engagement.
Use it to document:
- What you plan to test for this technique
- Specific targets, endpoints, or systems in scope
- Tools you intend to use
- Observations and notes as you work
- References, custom commands, or methodology steps
To open and edit TTP notes:
- Open the ATT&CK Navigator / ATLAS Navigator
- Click on any technique
- Go to the README tab
- Write your notes in markdown and save
This is completely up to you. Some operators use it as a pre-test checklist, others write notes as they go, and others skip it entirely. There's no right or wrong approach.
Think of TTP notes as your private scratch pad for each technique — tied to the engagement, visible to your team, and always there when you need context.
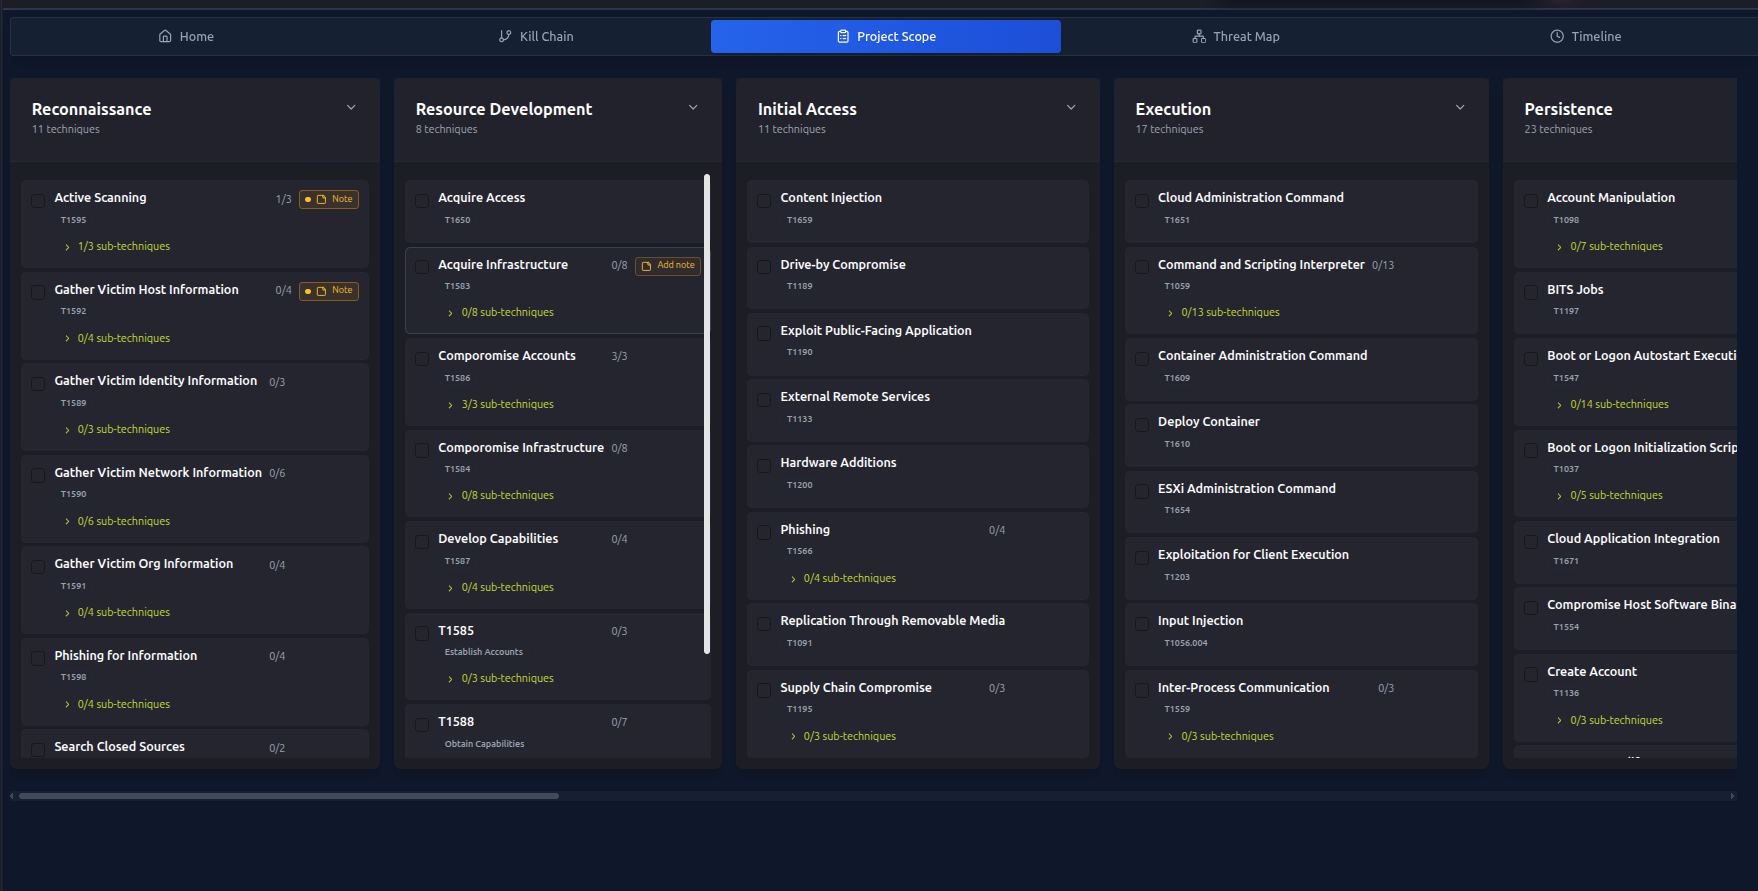
Step 8 — Start Working in the Navigator
Open the ATT&CK Navigator / ATLAS Navigator to see a visual map of all techniques. As you work through the engagement:
- Mark techniques as In Progress when you start testing them
- Mark techniques as Completed when you've finished
- The navigator automatically updates when you create findings
See ATT&CK Navigator → for full details.
Step 9 — Use the Web Terminal
SATLAS includes a built-in terminal. Run tools directly from the browser — no SSH client required.
Terminal sessions are automatically linked to the technique you're working on, keeping your command history organized by TTP.
See Web Terminal → for full details.
Step 10 — Record Your Findings
As you discover things, record them as Findings:
- Go to Findings in the sidebar
- Click Add Finding
- Select the MITRE technique it relates to
- Add a title, description, and optionally attach a screenshot
- Set the status to In Progress or Completed
When you mark a finding as completed, the related technique in the navigator updates automatically.
See Managing Findings → for full details.
Step 11 — Review Your Progress
The Analytics Dashboard gives you a real-time picture of your engagement:
- How many techniques you've covered vs the total scope
- Which tactics have the most coverage
- Your findings timeline
- Top tools used during the engagement
See Analytics Dashboard → for full details.
You're Ready!
That's the full RTF workflow. As you get comfortable, explore:
- C2 Infrastructure Mapping → — map your beacons and nodes
- AI Tool Suggestions → — get tool recommendations for each technique
- AI/ML Model Scanning → — if your target includes AI systems